Racetrack

Racetrack
DSMC is already a valuable method to assess the behaviour of policies on a given track. To enable even deeper analysis we developed TraceVis, a 3D visualization tool build upon the CGV Framework. Extending the two-dimensional domain of Racetrack, TraceVis makes use of the third dimension to map additional features.
We chose the name based on one of the main features of the tool, which is visualizing traces. A trace, in this context, is what we call a complete run of the agent from a given start configuration until it reaches the goal or crashes. Additionally, TraceVis is able to show statistical information like goal or crash probabilities, either for the whole track or chosen start configurations.
An extensive explanation of the visualization and interaction method can be found in the associated paper.
Without data, of course, nothing can be visualized. To this end we generated a complete set of runs for each start configuration using The Modest Toolset. A single start configuration consists of the initial position and velocity. For a detailed explanation we refer to the aforementioned paper.
The track itself is represented as a grid of boxes. This visually breaks apart the individual track cells, to allow for easy perception and enables us to map statistical values to the color and height of the boxes. An example is given in the figures below, showing the crash probability of a single start velocity for each track position, once without and once with height mapping.
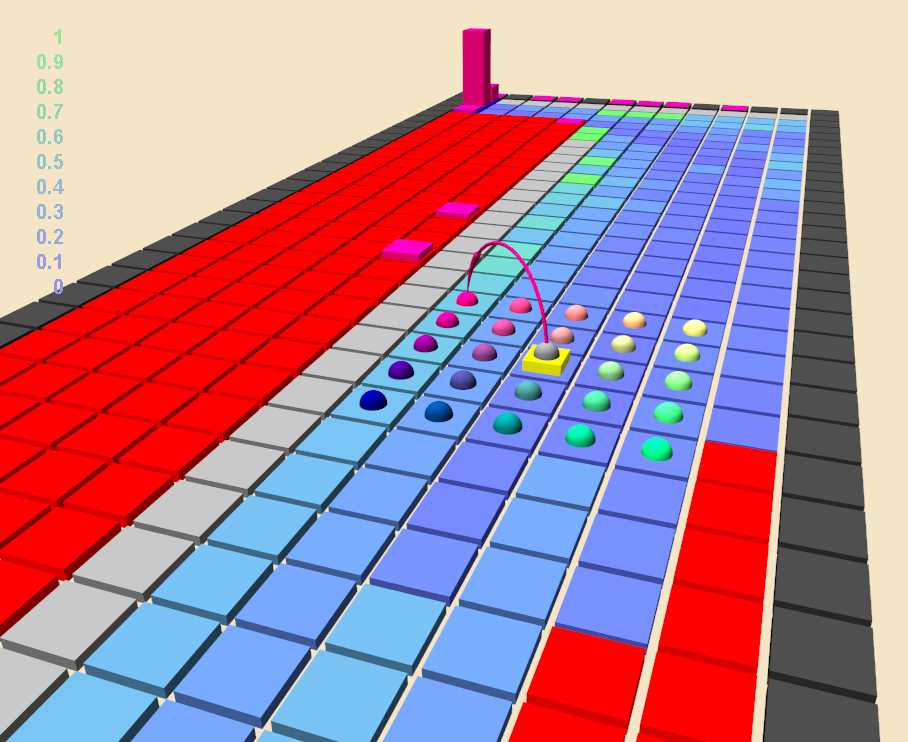
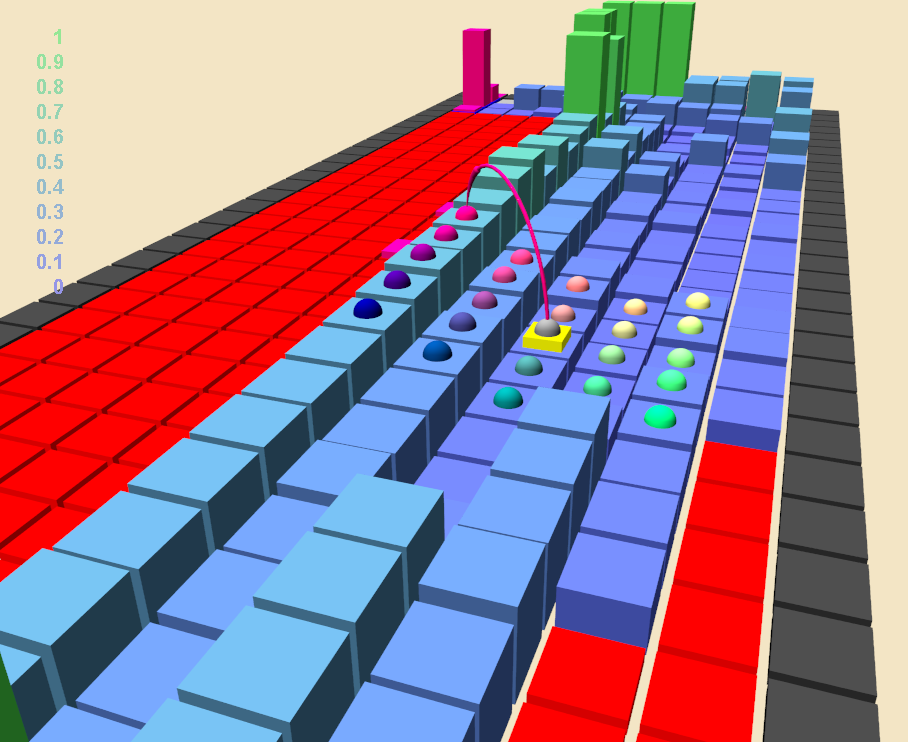
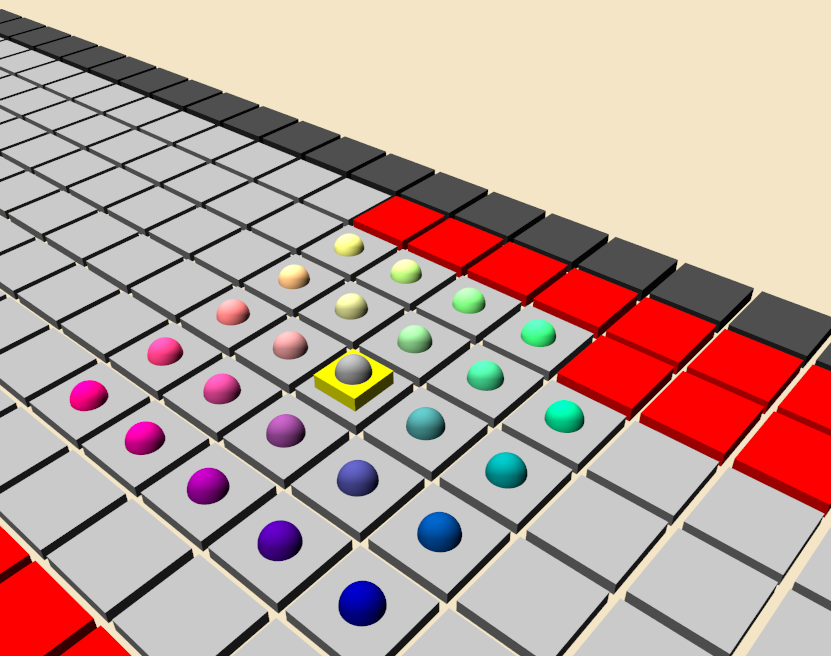
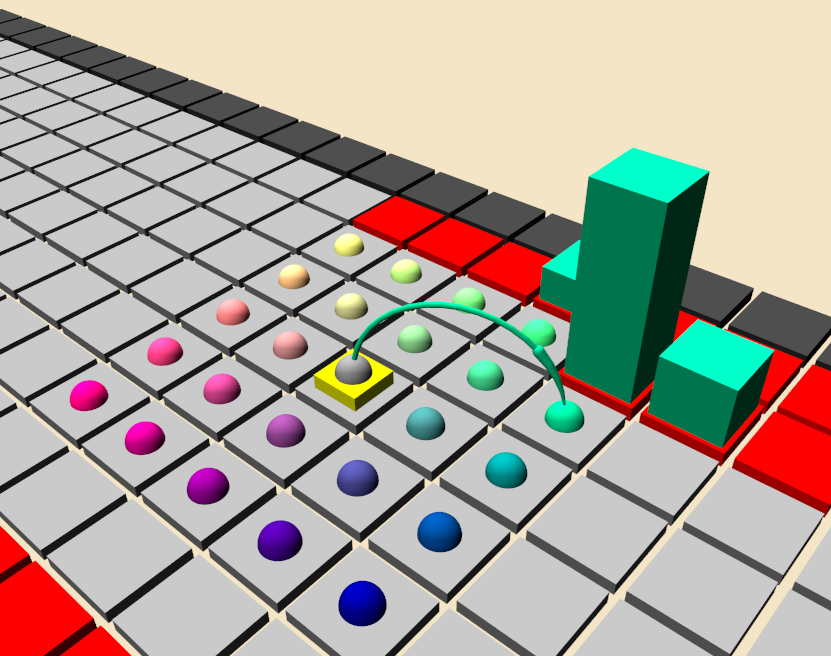
The start configuration selector is also shown on these images. While an extensive amount of settings can be adjusted from the GUI, the user is able to interact with this selector directly on the track. Selecting start configurations is therefore easily done by holding the shift or control key and dragging the mouse pointer over a box. Below, some detail views on the selector in different states are given.
From an analysis standpoint it is not only interesting to see what start positions have a high crash probability but also where the crashes occur. This is depicted by the boxes shown on the track walls and borders. Their height corresponds to the probability of the agent crashing at this position, given the selected start configuration. When all start velocities are selected (right), thinner boxes are drawn and positional encoding is used in addition to coloring. This helps to assign the individual velocities to their corresponding box glyphs.
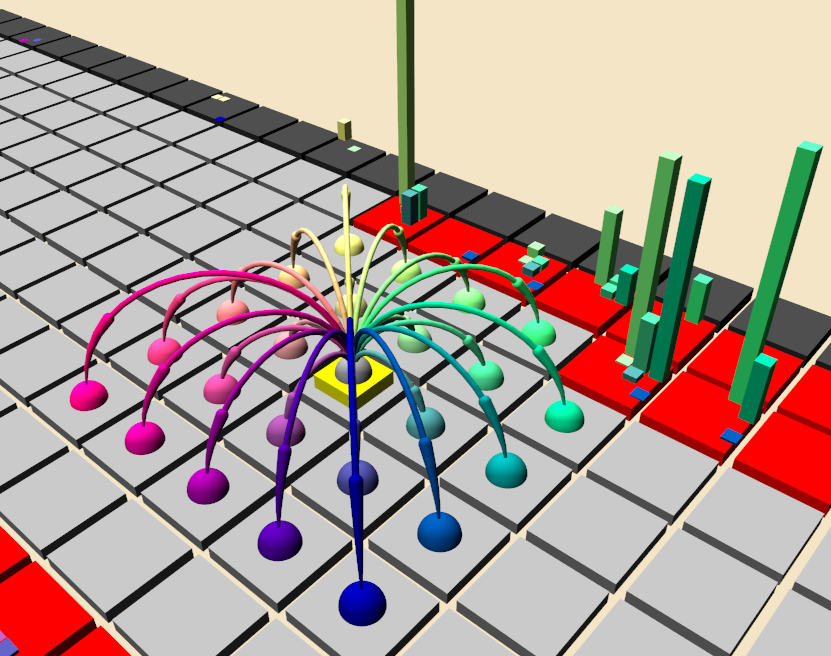
Visualizing traces is, much like the start configuration selector, done by combining sphere and tube primitives. Using GPU-based ray casting helps to deliver a high quality and visually pleasing rendering of the geometry. Traces are always shown for a single start configuration. Because of the noise, a multitude of different traces is generated. Visual clutter is prevented by sorting, clustering or aggregating traces by their outcome or paths taken. Color is applied as an additional means to convey attributes. Examples are given below, with the left image showing stacked and sorted traces.
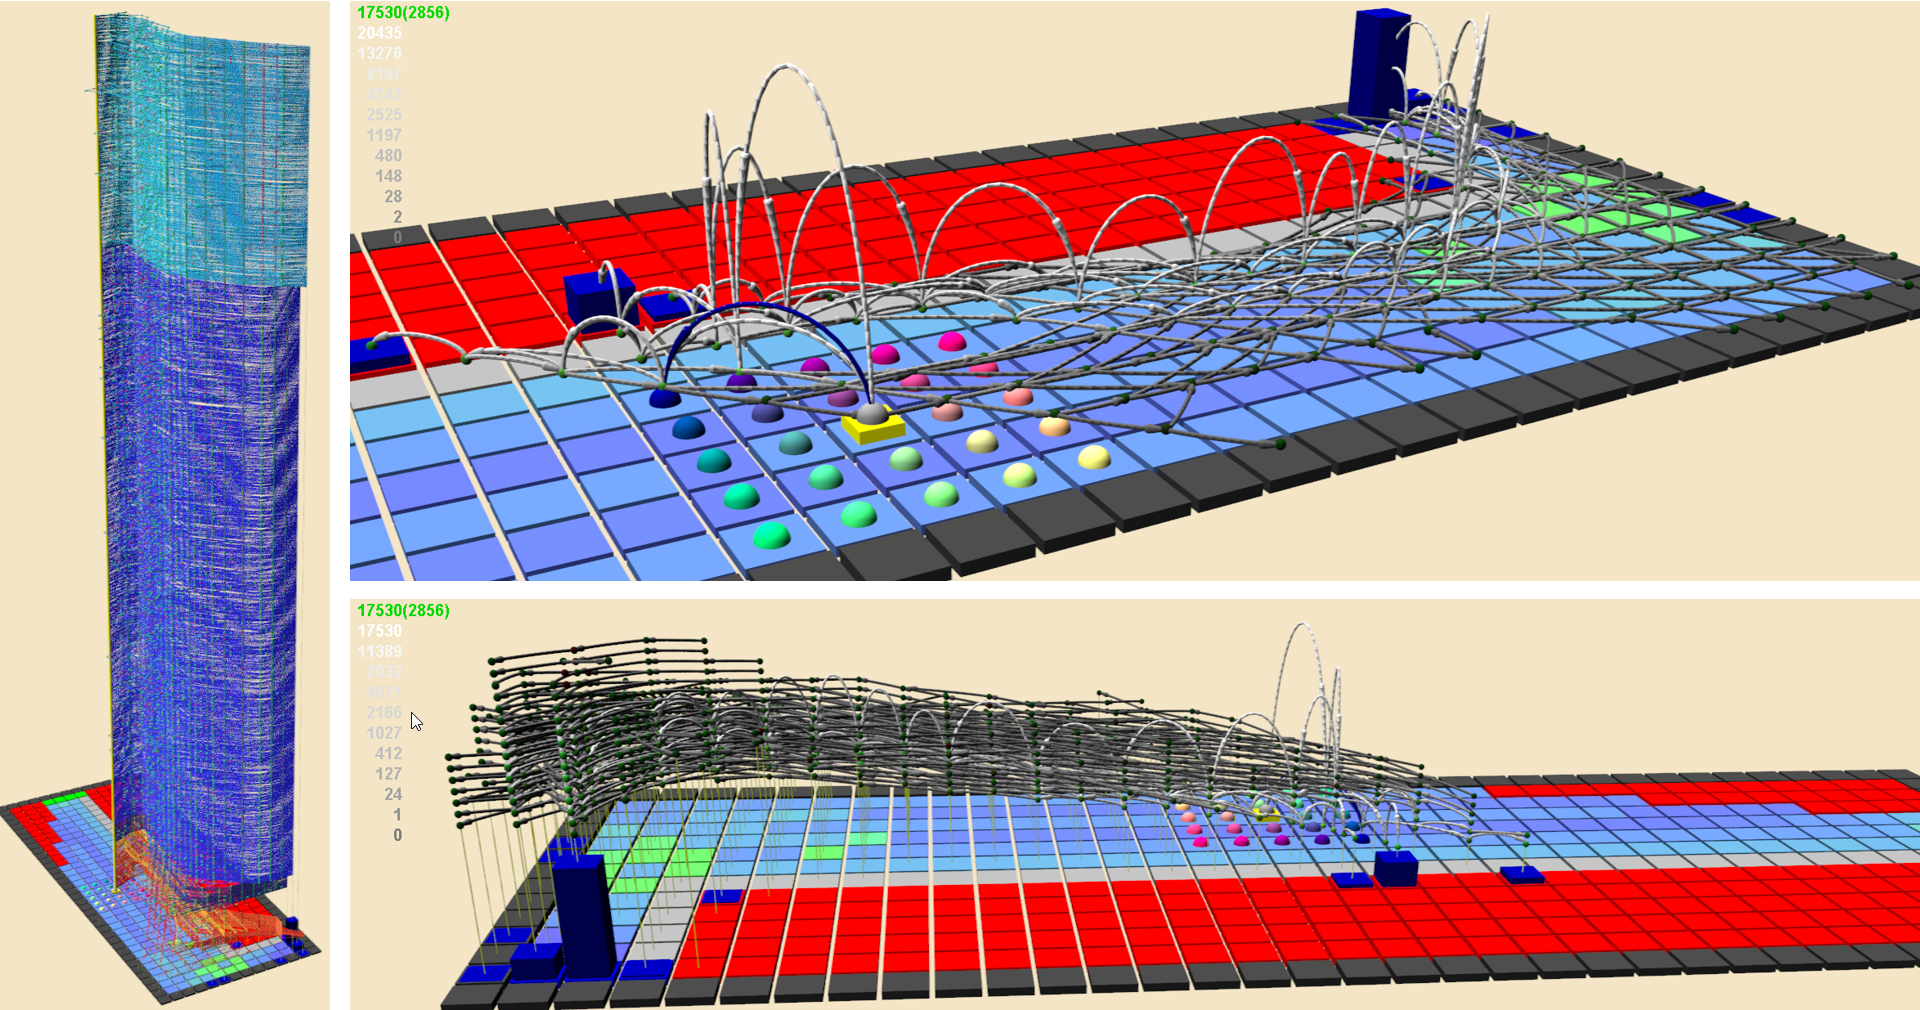
The images on the right show aggregated views. Using arrow arcs instead of straight connections allows to map additional attributes to the arc height and furthermore shows the movement direction. In the case of the upper right image, the relative frequency of a trace moving along a certain path is used for that purpose. Bottom right shows a space-time plot, which is useful to discern paths based on the time they take to reach the goal.
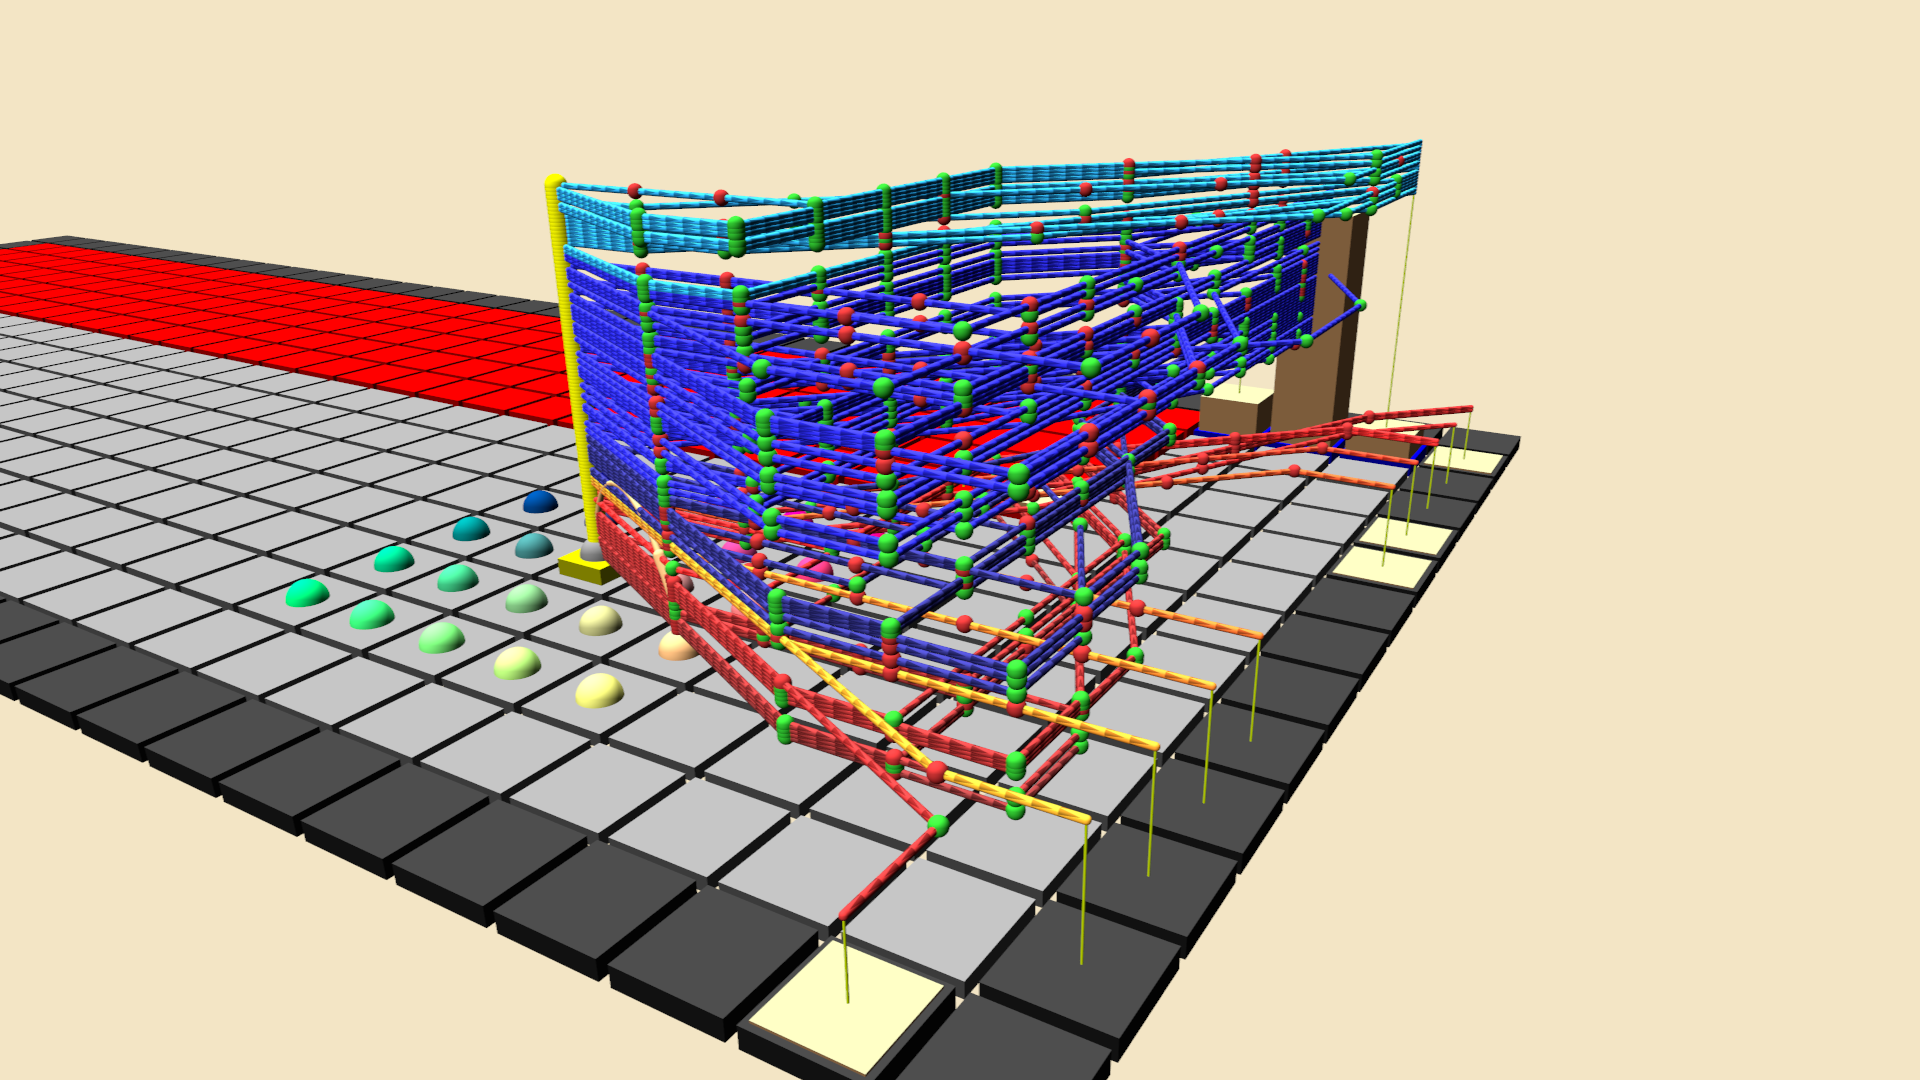
A closer view on stacked traces is shown in the following left image. Color is used to group traces based on their terminating position, which is either on a goal or an invalid (wall or border) track cell. Orange to reddish colors are used for crashed traces while successful traces are shown in blue. The right image shows a view of a single cluster, in this case a goal cluster.

All visualization modes allow the user to access the behaviour of the policy under different start conditions and on different parts of the track. They help to quickly discover preferred paths, as well as dangerous configurations that lead to a crash.
As TraceVis is a highly interactive tool, its usage is best presented in a video demonstration:
The video can also be viewed here.